Circulation in the Atmosphere: Earth's tilt, orbit, rotation, and the redistribution of energy
Listen to this reading
Did you know that “trade winds” were so named because seafaring merchants relied on them to drive their vessels in search of spices and other goods? One of the earliest explorers known to diligently record and use wind direction, wind speed, and ocean current in his voyages was Christopher Columbus. Along with other factors, the large-scale circulation of air and ocean currents plays an important role in determining climate in different locations around the world.
Imagine boarding a flight in Los Angeles, California, bound for Juneau, Alaska. On your way to the airport, you would probably experience typical LA weather: warm, sunny, and dry. And when you got off the plane in Juneau, 5000 kilometers to the northwest, you could bet that the temperature would be cooler, wetter, and there’d be a decent chance of rain. After all, Juneau averages 160 centimeters of precipitation every year, while LA averages only 45 cm per year.
You would plan for this and pack appropriate clothing because, even though the weather might vary from day to day in each location, the average weather in each place is consistent. This average of weather over time is called climate, and it includes not only temperature and precipitation, but the speed and direction of prevailing winds, humidity, atmospheric pressure, and many other conditions that occur as a result of typical weather patterns. While the weather might be difficult to predict from day to day, climate doesn’t change that fast – it is the average of weather over several decades.
The climate in different parts of the world is strongly influenced by the distribution of energy we receive from the sun, which depends on Earth’s shape and tilt. Climate is also affected by the large-scale, global circulation of the atmosphere and oceans, which are driven by solar heating and Earth’s rotation, and are influenced by the locations of the continents and mountain ranges. Today, we consider it trivial to check the weather instantly, anywhere around the globe, but it wasn’t always that straightforward. Our understanding of Earth’s climate was built by scientists on the observations of winds and currents by ocean-going explorers, which they combined with their new understanding of Earth as a rotating sphere orbiting the sun.
The shape, tilt, and orbit of Earth
The energy Earth receives from the sun plays the biggest role in determining our planet’s global average temperature (see Factors that Control Earth's Temperature for more explanation). But every place on Earth does not have the same temperature and climate. One important reason for this variation is that different latitudes on Earth receive very different amounts of incoming solar radiation, known as insolation. That’s because our planet is a sphere, so incoming sunlight hits different latitudes on Earth’s surface at different angles and the same amount of energy is spread over a smaller or larger area. At lower latitudes near the equator, solar radiation strikes the surface nearly perpendicularly, while closer to the poles, it comes in at an increasingly oblique angle (see Figure 1).
Figure 1: Diagram showing the same amount of sunlight hitting different latitudes of Earth’s surface. Further away from the equator, at high latitudes, energy from the sun has to pass through more atmosphere, represented by the length of the black lines, and is spread out over a larger area on the surface, shown by the size of the ovals. Closer to the equator and at low latitudes, energy from the sun has to pass through less atmosphere. The band of latitude between 23.5° N (the Tropic of Cancer) and 23.5° S (the Tropic of Capricorn) is called the tropics. Map data: SIO, NOAA, U.S. Navy, NGA, GEBCO, US Dept. of State Geographer; Image: Landsat, Google.
image ©Image by Dr. Anne E. Egger CC BY-NC-SA 4.0As a result, the amount of energy from the sun that hits the surface near the equator and is spread over a relatively small area in the tropics is spread over a greater area at high latitudes, closer to the poles (Figure 1, yellow ovals), and thus insolation is lower at higher latitudes. In fact, insolation is about a third less than that at the equator in Los Angeles, at 34° N, and in Juneau, Alaska, at 58° N, insolation is about half of that at the equator.
Insolation at high latitudes is further reduced for two additional reasons. First, the low angle of incoming light forces it to pass through more of the atmosphere, as shown in Figure 1 by the relative length of the black lines: the line near Juneau, Alaska, is much longer. Gases and particles in the atmosphere absorb and scatter radiation, decreasing the amount of energy that reaches the surface. Second, the low angle of incoming sunlight causes more of the radiation that does reach the surface to be reflected, the same way that light hitting water at a low angle (such as at sunset) is reflected.
If Earth’s equator were in the same plane as Earth’s orbit around the sun, the latitudinal difference in insolation would remain the same throughout the year. However, Earth’s equator is tilted at an angle of 23.5° from the plane of Earth’s orbit, as illustrated in Figure 1. The latitudinal band between 23.5° north and south is called the tropics, and it is the region that receives the most “direct” energy from the sun. Because of Earth’s tilt, the North Pole is pointed slightly toward the sun during about half of its yearly orbit around the sun (April through September) while the South Pole points slightly away. During the other half of the year (October through March), the reverse occurs.
Whichever pole is angled toward the sun, that hemisphere receives more solar radiation and experiences summer, while the opposite hemisphere experiences winter. Seasonal differences are amplified by the fact that the sun remains above the horizon for more hours per day in the summer hemisphere, allowing the surface to absorb even more radiation. While you may have thought that the seasons were caused by changes in the distance between Earth and the sun that result from our planet’s elliptical orbit, that is not the case. The difference in insolation that results from that change in distance is tiny compared to the difference in insolation that results the tilt of the Earth, which is the primary determinant of the seasons.
Comprehension Checkpoint
Earth’s energy imbalance
Summed up over the course of a year, the poles receive less insolation than the tropics, even though the sun shines 24 hours a day during the polar summer. That’s because of two reasons. First, radiation at high latitudes is always at an oblique angle, never direct, so it travels through more atmosphere (as you can see in Figure 1) and is also more likely to be reflected. Second, surfaces like snow and ice, which are common at the poles, have a higher albedo and thus reflect a large fraction of incoming radiation. The result is that the amount of solar energy absorbed at the surface peaks in the tropics (the red line in Figure 2).
Figure 2: Graph showing how incoming radiation, or insolation, and outgoing radiation vary with latitude. The tropics receive more solar radiation than they emit, creating an energy surplus, while the polar regions emit more than they receive.
image © University Corporation for Atmospheric Research (UCAR)However, Earth is also losing energy from every point on its surface. Even if you can’t see it, you’ve experienced this kind of energy before, perhaps standing on asphalt on a sunny summer day or putting your hand over a pan on the stove to see if it’s hot. Like asphalt or a hot stove, everything around us emits long-wavelength infrared radiation (see Factors that Control Earth's Temperature for more explanation). That’s why Earth maintains a steady temperature: If it just kept absorbing solar radiation, it would grow warmer and warmer. The poles lose slightly less energy than the tropics, because they are colder and emit less radiation (the blue line in Figure 2). But what is lost at high latitudes is greater than the than the amount absorbed from incoming radiation. This is shown by the black line in Figure 2, where the net radiation (incoming minus outgoing) is positive near the equator and negative near the poles. In other words, there is a net surplus of energy in the tropics and a net energy deficit near the poles.
This imbalance of energy drives large-scale movements of air and water that redistribute energy throughout the Earth system through familiar processes like wind and ocean currents, both of which represent parts of global circulation systems. These circulation systems play an important role in determining the climate in different locations around the globe. They are also important to humans, who have relied on these circulation systems for centuries – long before they understood what caused them.
Comprehension Checkpoint
Energy redistribution through air circulation
When Christopher Columbus sailed to the New World in 1492, it took him and his crew just a little over a month to make the 6,000-kilometer voyage from the Canary Islands off the coast of Africa to the Caribbean (see the solid red line in Figure 3). Columbus did not set a straight line course heading west from the coast of Portugal, but first sailed south toward the equator, and then headed west from the Canary Islands, catching winds that blew from northeast to southwest. In meteorology, winds are named after the direction from which they blow, so these winds are called easterlies.
Figure 3: Map showing Christopher Columbus’ routes across the Atlantic.
image ©Public DomainColumbus used the easterlies to drive his vessels in the direction he wanted to go on all four of his voyages (see Figure 3). He was one of the first explorers to use this feature of the climate system to his advantage, or at least, the first to make it well known: He and others were astute observers and recorders of the wind direction and speed, and Columbus’ daily journal entry almost always includes a statement about the nature of the wind, as well as the current (Columbus, 1493). As more and more ships made the journey across the Atlantic Ocean to the Caribbean islands to bring back spices and other merchandise, these consistent winds came to be known as the "trade winds." While he relied on them heavily, virtually nowhere in his journals does Columbus speculate about why the trade winds blew as they did. At the time, most still relied on Aristotle’s explanation in his 350 BCE publication Meteorology, in which he stated that wind was a vertical exhalation from the Earth that moved horizontally following the motion of the heavens (Aristotle, 350 BCE), a notion that placed Earth at the center of the universe.
Fifty years after Columbus returned from his first voyage, in 1543, Copernicus published his heliocentric model of the solar system, where a rotating Earth traveled around the sun. But it wasn’t until 1616, well over a hundred years after Columbus’ first voyage, that Galileo Galilei suggested that the trade winds might have something to do with Earth’s rotation, that they might occur because the rotating Earth turned too fast for the atmosphere to keep up. Since the planet spins towards the east, this would cause the winds to appear to blow the opposite direction – from east to west. Galileo applied Copernicus’ model to processes happening on Earth, not just the apparent motion of the stars. If these ideas were correct, however, the winds everywhere on Earth would blow the same direction, which we know isn’t the case (see Figure 4 to compare observed winds and predicted winds).
Figure 4: Observed versus predicted winds based on Earth's rotation.image © Map data: SIO, NOAA, U.S. Navy, NGA, GEBCO, US Dept. of State Geographer; Image: Landsat, Google.
image ©Image by Dr. Anne E. Egger CC BY-NC-SA 4.0About 70 years later, several scientists converged on similar explanations for the trade winds. At a meeting of the Royal Society of London in 1686, Edmond Halley, an English physicist and astronomer, proposed that the trade winds arose from intense solar heating of the tropics (Halley, 1686). Halley thought that heated air would follow the sun during the day, which would pull it from east to west to form the trade winds. He compiled and described wind directions from different regions, invoked the idea that heated air expands, and portrayed his ideas in a map, shown in Figure 5. Halley was onto something. As explained above, the tropics do receive intense solar radiation. This energy heats the surface and the air right above it, and because hot air is less dense than cold air, it rises into the atmosphere.
Figure 5: Halley’s map of wind directions included in his 1686 paper in the Philosophical Transactions of the Royal Society of London.
But Halley and others in the Royal Society still had a hard time developing a convincing explanation for why the trade winds blow from the northeast in the northern hemisphere and the southeast in the southern hemisphere, not just straight east to west.
Half a century later, an English meteorologist named George Hadley proposed a new idea in a paper in the Philosophical Transactions (Hadley, 1735). He benefited from more detailed observations of wind and currents by several sailors, including William Dampier, an English pirate, whose 1699 account of his voyages included a “Chapter of Winds” as an appendix. Dampier described the strength and direction of winds across the worlds’ oceans, including tables with latitude, longitude, and wind direction (Dampier, 1699). Hadley made use of this and other accounts, and conducted a thought experiment, first imagining how air would circulate when heated by the sun on a non-rotating Earth. He described how, if the sun-heated air rose over the tropics, air would flow in to fill the void. This air would come from both the north and the south and flow towards the equator, creating large convection cells in which heated air rose at the tropics, flowed north towards the pole as it cooled, then sank and flowed south to replace the rising air (see Figure 6).
Figure 6: An illustration of the first part of Hadley’s thought experiment, in which he imagined how air would circulate if the main factor influencing circulation was heating from the sun, which is strongest near the equator. image © Map data: SIO, NOAA, U.S. Navy, NGA, GEBCO, US Dept. of State Geographer; Image: Landsat, Google.
image ©Image by Dr. Anne E. Egger CC BY-NC-SA 4.0Then, in his thought experiment, he set the Earth in motion, and imagined how these convection cells would be affected. He dismissed Halley’s notion that the winds followed the sun’s path across the sky, which would cause the wind to change directions mid-day, every day. Then he carefully described how a point on the surface of the Earth (and the air above it) at the equator had to travel farther than a point at any other latitude as the Earth rotated, and therefore was also traveling faster. Why is this the case? Every point on Earth’s surface completes one rotation in the same amount of time – a 24-hour day. However, the distance each point has to travel to complete that rotation depends on its latitude. At the equator, a point on the surface travels the farthest to complete a single rotation, while near the poles, a point on the surface hardly moves at all. Thus, the speed at which a point on the surface rotates depends on its latitude (see Figure 7). Hadley reasoned that, as high-latitude air flowed toward the equator to replace rising air heated by the sun, the faster-turning tropics would rotate out from underneath it. From the surface, this would make it appear as though this flow of air was deflected to the west. In other words, surface air would blow from the northeast in the Northern Hemisphere and from the southeast in the Southern Hemisphere.
Figure 7: Part two of Hadley’s thought experiment in which he started the Earth rotating. image © Map data: SIO, NOAA, U.S. Navy, NGA, GEBCO, US Dept. of State Geographer; Image: Landsat, Google.
image ©Modified image by Dr. Anne E. Egger CC BY-NC-SA 4.0Using the same logic, Hadley accounted for the westerlies that occur to the north and south of the band of easterlies, or trade winds. The westerlies began, he noted, at the latitude where the heated air that had risen from near the equator had cooled enough to sink back down towards the surface. Because this air was now moving faster than Earth beneath it, as it moved northward it would be deflected to the east (see Figure 7).
Today, we know the concept that Hadley described as the Coriolis effect, named after French mathematician and engineer Gaspard-Gustave de Coriolis, who published a paper in 1835 describing energy and apparent motion in waterwheels and other rotating machines (Coriolis, 1835). Coriolis himself did not apply his ideas to Earth’s atmosphere: It wasn’t until the early 1900s that the principles described by Coriolis were applied to Hadley’s observations of the winds. You’ll sometimes hear this called the Coriolis force, which is a misnomer, because it isn’t a true physical force like gravity. Instead, the Coriolis effect is an apparent force induced by Earth’s rotation.
Comprehension Checkpoint
The Hadley cell and the Intertropical Convergence Zone
Over time, scientists realized Hadley’s explanation was largely correct, and the convection cell he described that resulted from the interactions between uneven heating of the sun and the rotation of the Earth is now called the Hadley cell. While Hadley himself was focused entirely on explaining the trade winds, the Hadley cell accounts for several other climatic observations in the tropical regions between 30° N and 30° S, including winds in the equatorial region and precipitation over a broad region of the Earth.
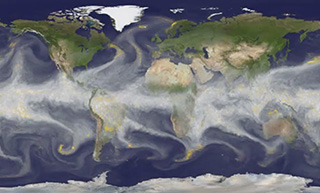
Sailors knew the region between 5° N and 5° S as "the doldrums," a stretch of open ocean where their sails caught little wind and their progress could stall. These calm conditions occur where the trade winds from the Northern and Southern Hemispheres converge and rise – that produces little wind at the surface and a zone of low pressure. The warm, rising air over the equator also carries a lot of water vapor, evaporated from the ocean by the sun’s energy. As this air rises and cools, the water vapor condenses, creating a persistent band of clouds and intense rainfall that is easily visible in satellite images of Earth, especially over the Pacific Ocean (see Figure 8 for an example). Today, meteorologists and climate scientists call this band of little wind, heavy rain, and low pressure the Intertropical Convergence Zone, abbreviated as ITCZ.
Figure 8: The band of clouds just north of the equator indicates the location of the Intertropical Convergence Zone (ITCZ). Data from NOAA GOES - http://goes.gsfc.nasa.gov/text/goes11results.html).
image ©Modified image by Dr. Anne E. Egger CC BY-NC-SA 4.0The warm air in the ITCZ rises until it reaches the tropopause, or the boundary between the troposphere and the stratosphere (see our module on the Composition of Earth's Atmosphere for more information), which is at a height of 16-18 km above Earth’s surface at the equator. At that altitude, the rising air diverges, with some flowing northeast and some flowing southeast (deflected from straight north and south by the Coriolis effect), following the tropopause while it cools and begins to sink. At about 30° N and S of the equator, the now cold, dry air sinks back to the surface. Exactly opposite to the ITCZ, these two latitude bands are regions of high pressure (since the air is descending) and very dry conditions, since the air contains very little water vapor. When the descending air reaches the surface, it again diverges, with some flowing back towards the equator as the trade winds, picking up moisture as it warms, and some flowing towards higher latitudes as the westerlies.
Figure 9: A diagram showing the relationship between the Hadley cell and continental climate. Note that the altitude of the tropopause is higher over the equator than over the poles, and the altitude is greatly exaggerated compared to the diameter of Earth.
image ©Modified image by Dr. Anne E. Egger CC BY-NC-SA 4.0While the observations that led to our understanding of the Hadley cell came primarily from sailors on the Atlantic and Pacific oceans, the effects of atmospheric circulation show up very clearly on continents as well. The continent of Africa, which straddles the equator and extends from about 37° N latitude to 35° S illustrates how the Hadley cell determines continental climate (see Figure 9). The deepest green color in the satellite images indicates dense vegetation, the Congo rainforest, which receives the heavy precipitation within the ITCZ. The tan-colored region between 15° and 30° N is the Sahara desert, where cold, dry air descends and there is very little rainfall or vegetation. In southernmost Africa, the Namibian desert stretches from about 20° to 30° S, also in the region of descending dry air.
Comprehension Checkpoint
Winds outside the tropics
The Hadley cell is the primary driver of circulation in Earth’s atmosphere, and produces the climatic conditions experienced on most of Earth’s surface. But while Hadley briefly mentioned why the westerlies might occur, he did not fully explain them – and in fact, they are a bit more difficult to explain. A full accounting of atmospheric circulation from the equator to the poles would not come until the mid-1800s, over 100 years after Hadley’s initial work.
An important contributor to this effort was Matthew Fontaine Maury, who compiled data on the speed and direction of wind and currents from sailors and scientific organizations around the world, and published his compilation in 1855 (Maury, 1855). Maury’s effort was not an attempt to explain why the winds and currents occurred. Instead, he said:
The primary object… was to collect the experience of every navigator as to the winds and currents of the ocean, to discuss his observations upon them, and then to present the world with the results on charts for the improvement of commerce and navigation.
Maury’s detailed and rigorous compilation allowed others to develop explanations, however, and that’s exactly what William Ferrel did. Ferrel was a schoolteacher in Nashville, Tennessee, who was unsatisfied with the explanations that other scientists had developed for the winds. Motivated by Maury’s compilation and building on Hadley’s work, Ferrel published a paper in 1856 that described circulation in the atmosphere (Ferrel, 1856). He began by summarizing Hadley’s ideas, "with which the reader is no doubt familiar," and then moved beyond the tropics.
Ferrel noted that the poles were regions of high pressure just like the bands near 30°, where cold, dense air sinks towards Earth’s surface and flows away from the poles. This sinking at the poles drives circulation in the polar cells, which operate over the Arctic and Antarctic regions. The Coriolis effect deflects the flowing air to the west, creating bands of polar easterlies. Both the north and south poles are regions of high pressure with little precipitation. You might be used to thinking of the south pole on Antarctica as a snowy place, but the average annual precipitation is 4.5 mm – far less than most parts of the Sahara desert, which average 25 mm/yr.
With both the polar and Hadley cells accounted for, Ferrel was left with the mid-latitudes, between about 30° and 60° N and S. This region seemed to present a contradiction, with air flowing from west to east at the surface, rising in colder regions at higher latitudes (around 60°), and sinking in warmer regions at lower latitudes (around 30°). But viewed in the context of the Hadley and polar cells, the winds in this region began to make sense. As Hadley had noted, the air descending at 30° diverged, with some flowing northward in the northern hemisphere and being deflected to the east by the Coriolis effect. Around 60° N and S, these warm westerlies flowing poleward converge with cold polar air, rising to the tropopause. This mid-latitude circulation cell is now called the Ferrel cell after the schoolteacher who first described it.
However, the Ferrel cell isn’t as constant or well-defined as the Hadley cell. Instead, the westerly flow of air breaks up into a series of eddies, swirls of air whose movement does not match the overall westerly flow (see Figure 8, and the animation in Figure 9). These eddies mix the mid-latitude atmosphere and transport heat from the tropics toward the poles; they also produce the mid-latitude storms that roll across weather radars, bringing strong winds and bouts of rain and snow.
The animation below shows how all of these cells interact to produce what we see on the surface: latitudinal bands of winds and precipitation that are relatively consistent from year to year.
Other factors that influence climate
Circulation in the atmosphere is not the only factor that influences climate. The same factors that create circulation in the atmosphere – uneven heating from the sun and Earth’s rotation – create circulation in the oceans, and the atmosphere and ocean are constantly interacting and influencing each other. In addition, the distribution of land masses constrains circulation in the oceans, and mountainous regions such as the Andes in South America and the Himalaya modify atmospheric circulation.
Over geologic time, the latitudinal bands of climate can shift as well, expanding and contracting as Earth’s temperature changes. During ice ages, for example, the polar cells expand, and the boundary between the polar and Ferrel cells shifts towards the equators. During warm periods, the tropics expand. In both cases, there are still climatic differences between the latitudes of Los Angeles and Juneau because the shape and tilt of Earth have not changed significantly. Instead, the way that Earth absorbs and radiates energy changes, as ice sheets grow or melt and greenhouse gas concentrations increase or decrease. About 27,000 years ago, the climate in Los Angeles was much cooler and wetter than it is today. No sailors were taking measurements at that time, of course – instead, we know that from the fossils of dire wolves, mammoths, beetles, and plants buried in the La Brea tar pits. At the same time, Juneau was covered by ice, which we know from the distribution of sedimentary deposits from glaciers in the area. Combining our modern understanding of how climatic conditions are determined with what we know about the distribution of climates in the past helps us better predict what might happen in the future, as the factors that influence climate change.